Kafka monitoring is important because monitoring cluster performance is crucial for diagnosing system issues. Additionally, monitoring dispels any doubt in your users’ minds that all messages are being properly processed. Remember, if you lose a user’s data, it can be extremely difficult to regain trust.
In this post we will discuss why Elasticsearch and Kibana are ideal Kafka monitoring tools and provide example metrics that detail what exactly should be monitored.
OpenSearch can also be used for monitoring just like you would use Elasticsearch. OpenSearch is an open-source search and analytics set of software. It is based on the Elastic Stack and was formerly referred to as Open Distro for Elasticsearch.
Just as the Elastic Stack has the dashboarding tool Kibana, OpenSearch also has a dashboard tool called OpenSearch Dashboards.
The following figures show how the flow of data changes depending on if you are using Kafka as your normally would or if you are monitoring Kafka status.
Normal Use of Kafka
Figure 1a. Diagram of how data moves between Producers, Kafka, Zookeeper, Consumers, Elasticsearch, and Kibana. This figure depicts how data moves in the normal use of Kafka for moving incoming data to the appropriate database(s).
Monitoring the Status of Kafka
Figure 1b. This diagram shows the flow of data when using Elasticsearch and Kibana as a Kafka monitoring tool. When monitoring the status of Kafka using Elasticsearch, data is sent to Elasticsearch directly from Kafka.
How to Monitor Kafka
Kafka performance can be monitored using information from both Kafka and the Operating System. First we look at how Kafka status is monitored. Key metrics like the status of the partitions and cluster will be found here.
1.) Kafka rate of receiving data and writing to offset per topic
This figure is showing the rate at which Kafka receives data. Kafka works best when there is a somewhat steady flow of data, not consistent, large spikes,
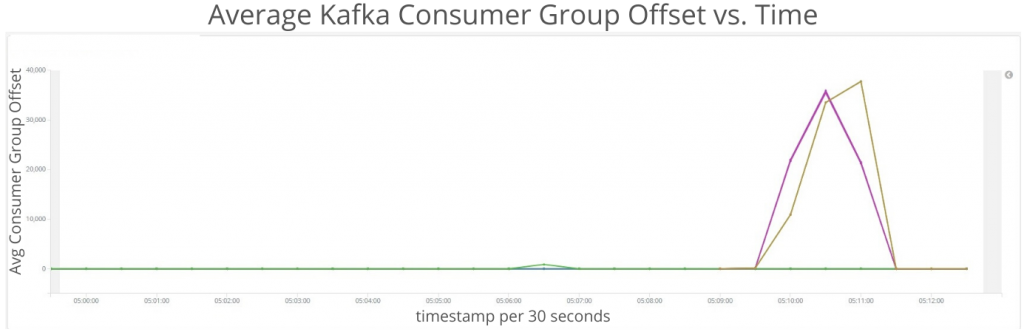
2.) Kafka consumer number behind current data
This figure tracks how far consumers are behind in the queue.
3.) Kafka partitions in sync
This figure is showing the status of replicas in Kafka.
4.) Kafka partition leaders
This figure is showing the number of partition leaders per Kafka instance. These values should be static unless adding or removing topics.
MONITORING OPERATING SYSTEM STATUS
It is also important to monitor the health of the operating system. Kafka relies heavily on the operating system for its page cache, hard drive space, and other system resources. As an example, excessive page cache misses points to the need for more brokers.
1.) Disk IO
This figure is showing disk performance. Disk performance is usually the limiting factor in Kafka, consistently high values here suggest you want to increase the IOPs (input/output performance) of the hard drives or add more Kafka brokers. Skewed values here hint that your cluster should be re-balanced.
2.) Memory
We expect to see steady Memory usage and zero Swap usage. Swap usage is a great indicator that your Kafka cluster is performing poorly.
3.) CPU
Kafka doesn’t use much CPU unless your batch size is too small.
4.) Networking
This figure is showing the rate of network traffic. Skewed values here hint that your cluster should be re-balanced.
5.) Load
Skewed values here hint that your cluster should be re-balanced.
If you have a highly customized installation of Kafka or find you need more information to troubleshoot your cluster, we recommend enabling JMX on the Kafka brokers. Logstash can pull the JMX data, send it to Elasticsearch, and provide you with any specific visualizations or alerts you may need.
If you have a highly customized installation of Kafka or find you need more information to troubleshoot your cluster, we recommend enabling JMX on the Kafka brokers. Logstash can pull the JMX data, send it to Elasticsearch, and provide you with any specific visualizations or alerts you may need.
24x7 Kafka Support & Consulting
24x7 Kafka Support & Consulting
24x7 Kafka Support & Consulting
Visit our Apache Kafka® page for more details on our support services.